India’s Electric Vehicle Market: A Look Back at 2023 Get...
Read MoreVineet Dravid
Founder & CEO oorja
Accelerated Degradation Predictions using Hybrid (Physics + ML) Simulations
oorja’s FADE application suite for Simulated Accelerated Testing can help accelerate cycler experimentation by 10 months. The application suite has been thoroughly validated for all aspects of cell degradation, and there is less than a 2% discrepancy between oorja’s results and experimental data. Moreover, oorja’s predictions have over 97% agreement with published data.
Introduction
During the cell selection process, it is critical to examine cell performance at various charge and discharge rates (C rates), temperatures, and depths of discharge (DoD) to make an informed decision on cell type and vendor selection. This requires accelerated testing.
However, running actual vehicle-level experiments at this early concept design stage is impossible. Further, physics-based models cannot perform accurate degradation predictions without the right set of parameters, which are difficult to obtain from cell manufacturers.
oorja’s unique approach addresses this challenge by combining data, physics optimization, and ML techniques. Thus, it provides a degradation signature both for various C rates and real-life drive cycles.
Approach
oorja uses HPPC and cyclic aging data to calibrate design, material, and degradation parameters of a cell. With a limited amount of cell cycler data, degradation predictions can then be performed on a larger set of conditions. oorja uses state-of-the-art physics-based models such as the Single Particle Model (SPM) and the Doyle Fuller Neumann (DFN) models. It accounts for SEI Layer growth, Li plating, loss of active material, and particle stresses to provide high-fidelity degradation estimates. This is combined with state-of-the-art numerical approaches, which ensure speedy computations.

Through this approach, oorja can help cut down the amount of cycler experimentation required by 10 months.
Analysis
Here is a representative case where a limited set of cell cycler data for a set of conditions is considered for training, and oorja predicts degradation for the entire map of C rates, temperatures and DoDs required for the cell qualification study.
Training Data Set

As described above, a single cycler data set (0.5C charge-1C discharge, 300 cycles) is used for the training to perform predictions across C-rate, temperature as well as DoD ranges.
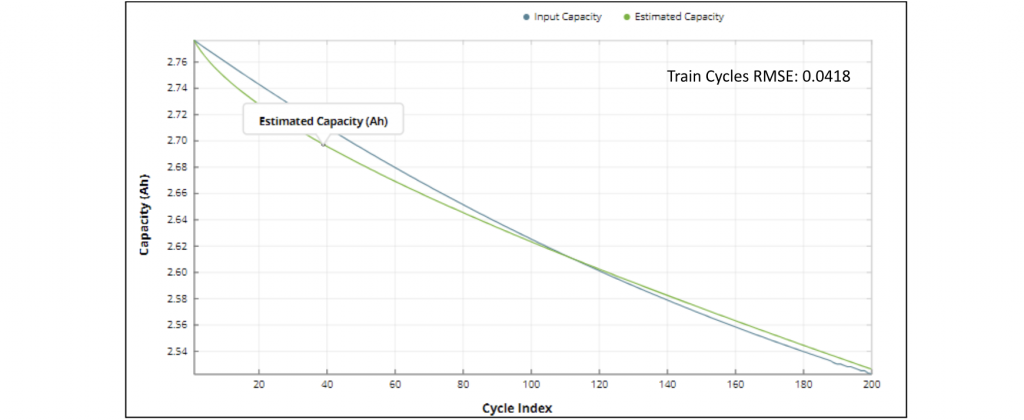
Fig.1: Extracting training parameters from one dataset- 300 Cycles of 0.5C Charge- 1C Discharge data[1].
Using these trained models, we now simulate the entire accelerated testing set for the cell as follows:
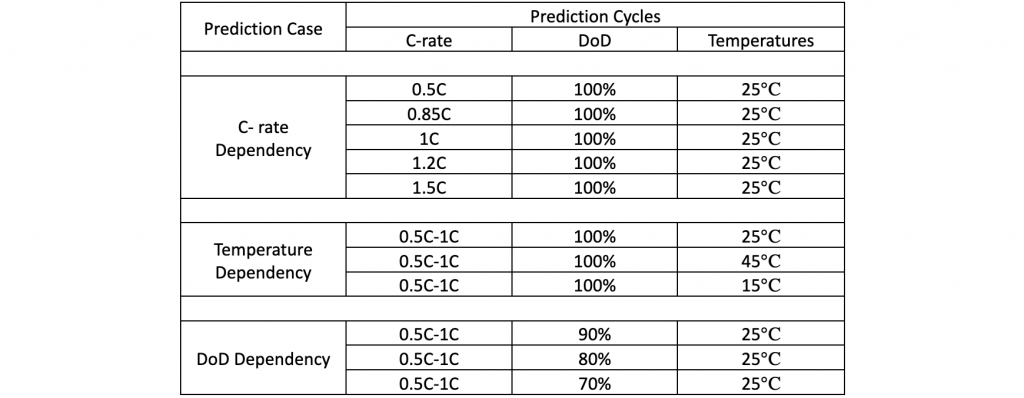
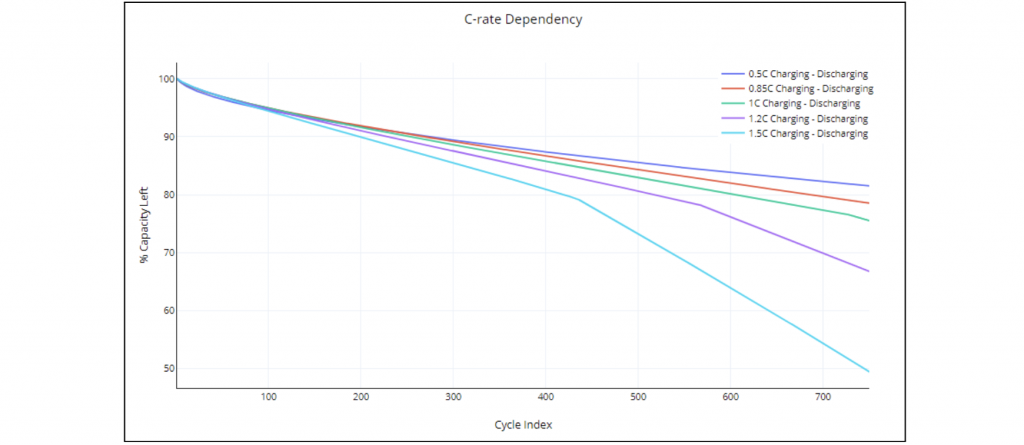
Fig.2: Capacity Fade Predictions for Different C-rates using 0.5C-1C Training Model.
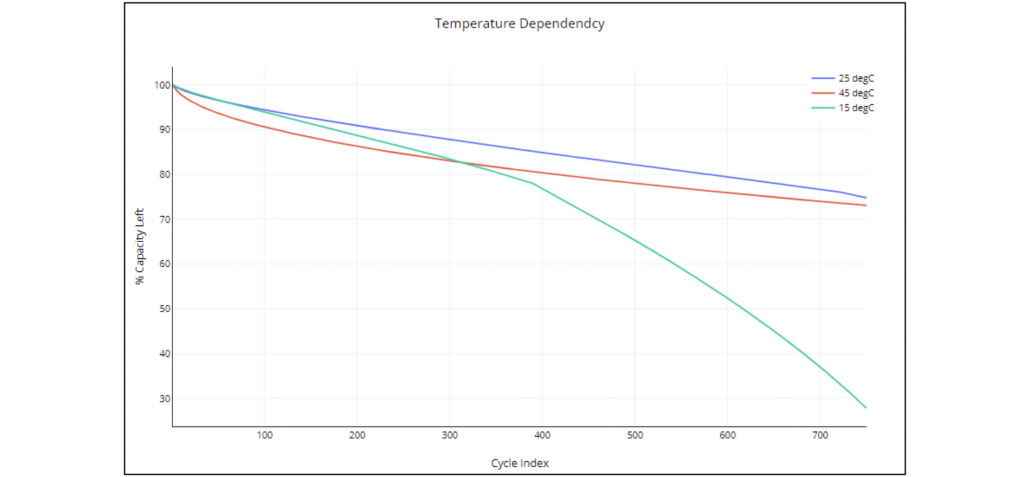
Fig.3: Capacity Fade Predictions for Different Temperatures using 25℃ Training Model.
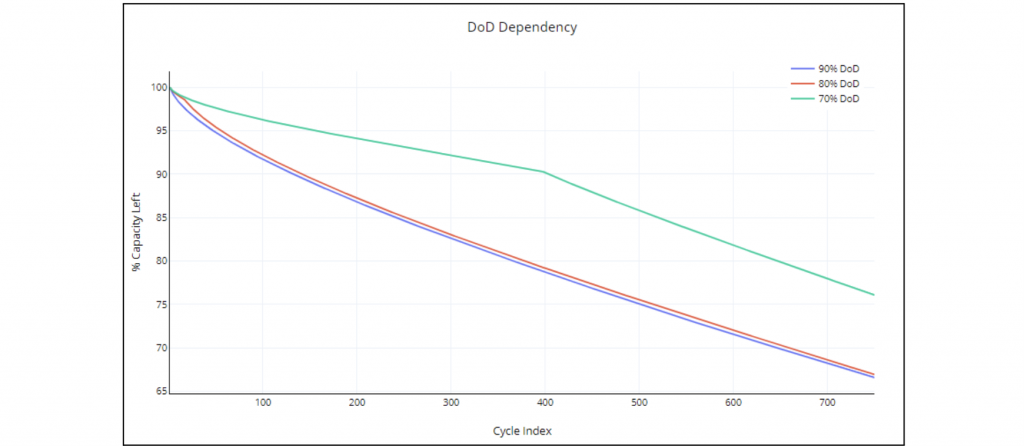
Fig.4: Capacity Fade Predictions for Different DoDs using 100% DoD Training Model.
Figure 2 shows the expected degradation trend, i.e. higher degradation with higher C-rates. Further, oorja can predict whether a cell is going to exhibit a knee-behaviour in degradation when the C-rate is higher. Figure 3 shows the degradation predictions for different temperatures. As expected, both low and high temperatures increase degradation. In Figure 4, degradation predictions are shown for the cycling done at different DoD levels, whereas training parameters are determined using the 100% DoD-cycler data.
Validation
oorja’s FADE application suite has been extensively validated for all aspects of cell degradation. Figures 5 and 6 show the comparison of experimental data[1] and published literature[2].
For the purpose of experimental validation, for the initial 300 cycles of 0.5C charge- 1C discharge data is used to train the model and estimate degradation parameters. Based on this training, oorja prediction is performed for 750 cycles. The percentage error between oorja results and experiment data is less than 2%, as shown in Figure 5a. As a result, the voltage discharge curve, plotted for cycle number 400, is also in good agreement with the measured values.
Similarly, the LG M50 cell’s parameter set is used to perform the degradation predictions for 1000 Cycles with 0.3C charge and 1C discharge. Figure 6 compares oorja predictions and published data[2], which has a maximum error of less than 3%.
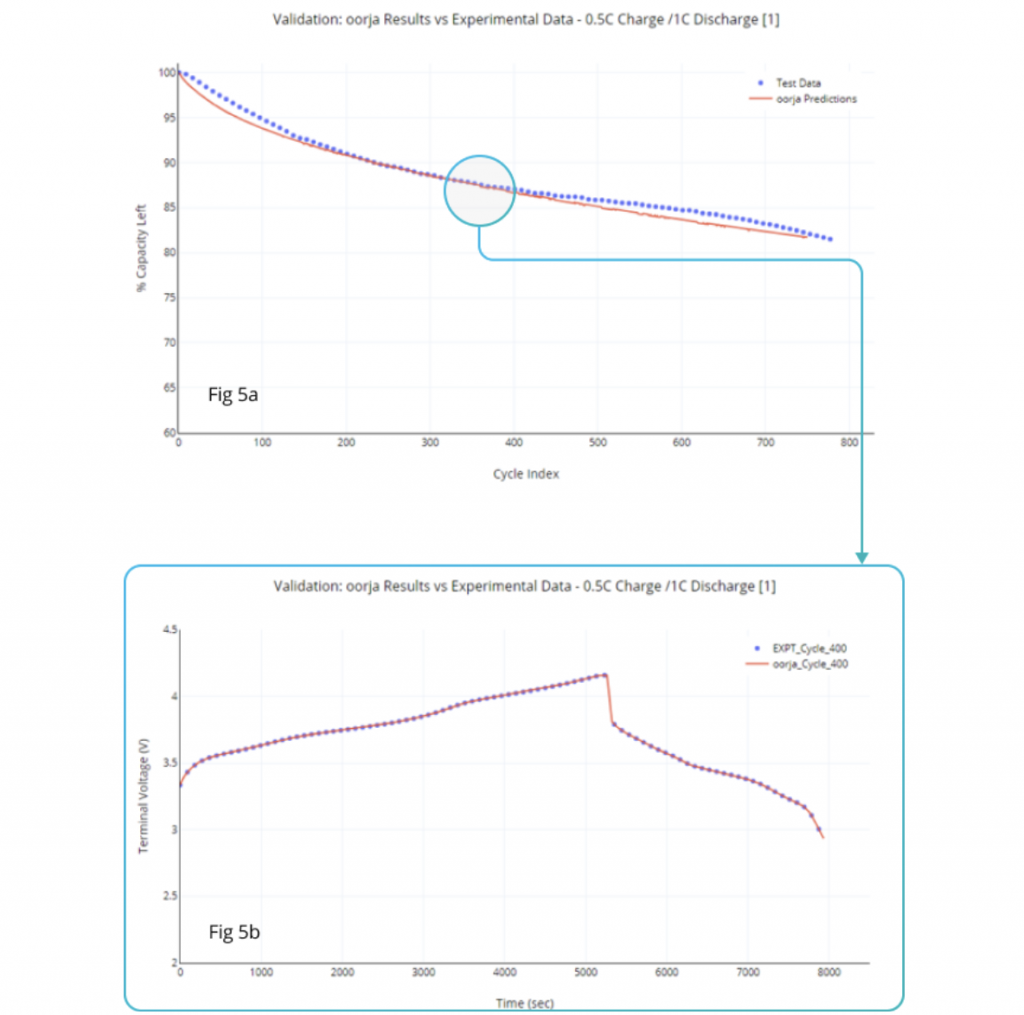
Fig.5a: oorja Capacity Fade – Results Comparison with Experimental Data[1].
Fig.5b: oorja Voltage Curves – Results Comparison with Experimental Data[1].
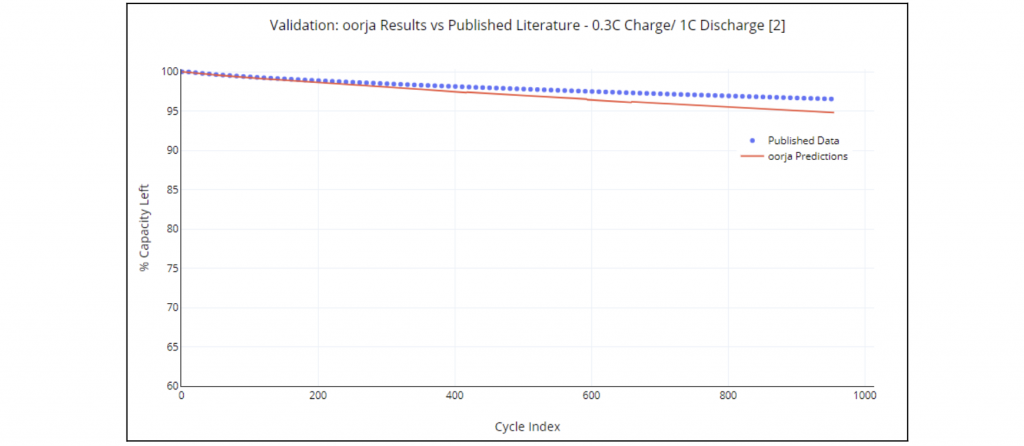
Fig.6: oorja Results Comparison with Published Literature[2].
To explore how you can use oorja to simulate accelerated testing, contact us at info@oorja.energy
References:
- SNL Group: www.BatteryArchive.org
- Simon J. O’kane et.al, “Lithium-ion battery degradation: how to model it”, Physical Chemistry Chemical Physics, 2022, № 13, p. 7909-7922.
Latest Blog Posts
Hybrid Modeling: Bridging Physics and Machine Learning
Hybrid Modeling: Bridging Physics and Machine Learning Get Started Contact...
Read MoreAccelerated Degradation Predictions using Hybrid (Physics+ML) Simulations
Accelerated Degradation Predictions using Hybrid (Physics+ML) Simulations Get Started Contact...
Read More

